


A Scientific Assessment of the State of the Planet

The Planetary Health Check (PHC) report provides an assessment of the state of our planet. It is based on the Planetary Boundaries (PBs) – the nine processes that are known to regulate the stability, resilience (ability to absorb disruptions) and life-support functions of our planet.
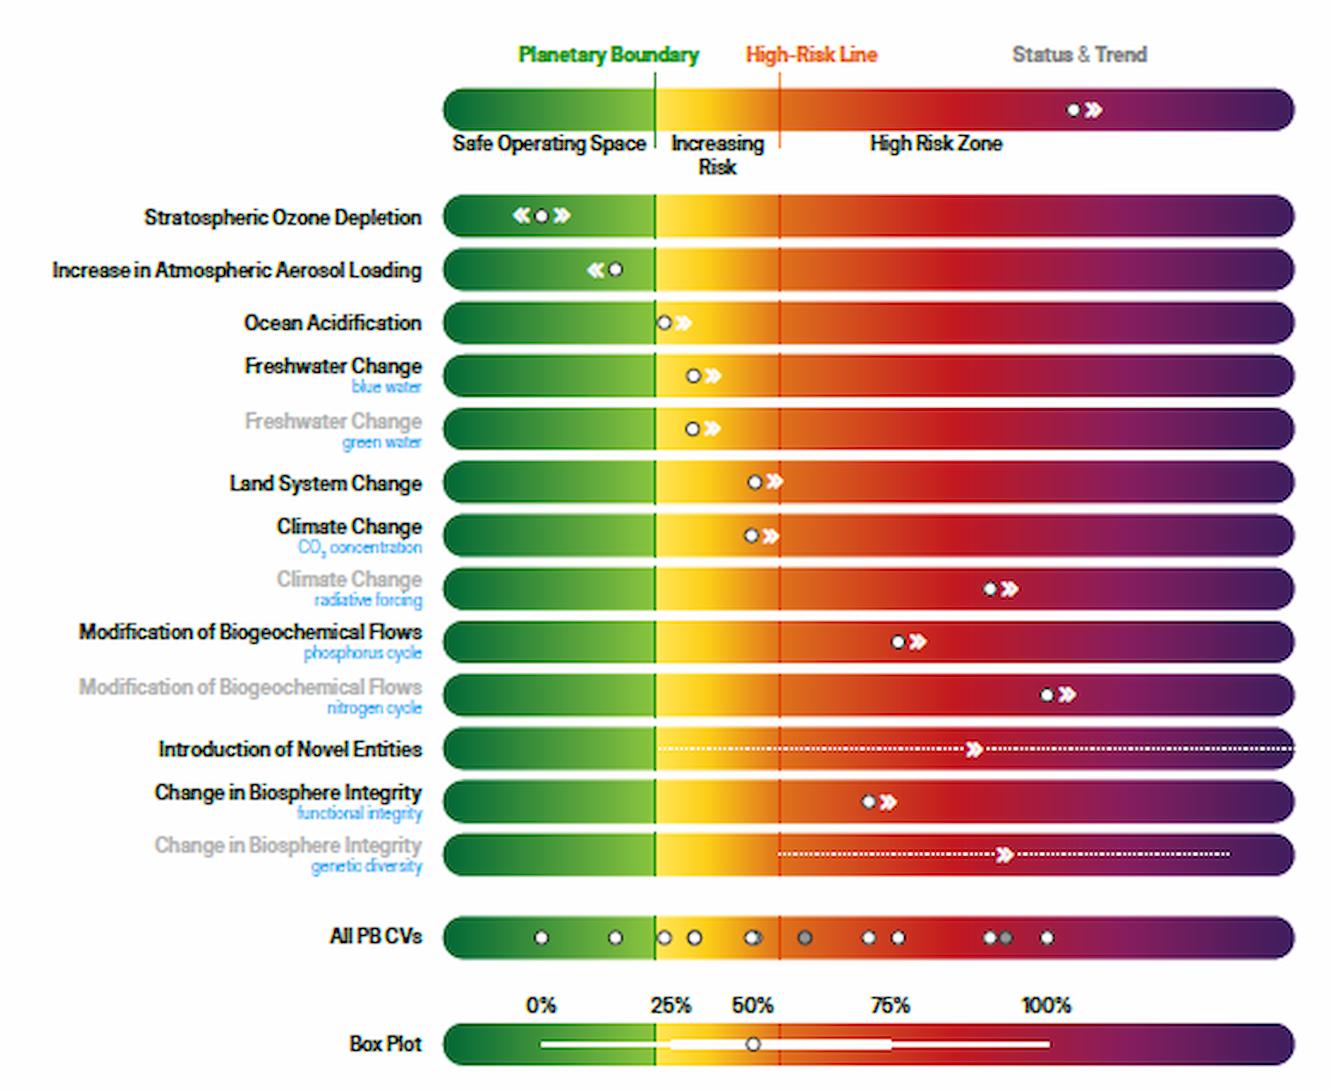
Each of these processes, such as Climate Change or Ocean Acidification, is currently quantified by one or two control variables. The 2025 PHC report concludes that seven out of nine Planetary Boundaries have been breached, with all of those seven showing trends of increasing pressure – suggesting further deterioration and destabilization of planetary health in the near future.
The Basics of Planetary Boundaries
For over 10,000 years, humanity has thrived within a period of climatic stability and a resilient Earth system. This epoch is called the Holocene, and it provided conditions that enabled the rise of agriculture, urbanization, and complex civilizations.
However, since the mid-20th century, we have entered a new epoch marked by what is called “The Great Acceleration”, where both socio-economic activity and environmental impact have surged exponentially. This was the beginning of the Anthropocene – the current era, in which human activity has become the dominant force of shaping the Earth system.
The dynamic Planetary Health Check symbol represents the summary of each year’s findings. The stylized boxplot (white lines and blue dot) describes the distribution of all PB control variables, which are individually shown in Fig. ES 1. The thin line represents the full range of all control variable values, while the thicker line represents the range that half of all control variable values fall into. The blue dot represents the median of all control variables.
The Earth system possesses an intrinsic capacity for selfregulation that has historically helped maintain Holocenelike conditions favorable to civilization.
This resilience stems from tightly coupled interactions and feedback processes among the biosphere, climate, and other planetary processes, evident in the long-term stability of the Holocene and previous interglacial periods. Over the past 150 years, this resilience has absorbed more than half of human-induced greenhouse gas emissions through land and ocean carbon sinks.
However, mounting evidence shows that this carbon uptake capacity is weakening: Natural carbon sinks on land are saturating or turning into carbon sources, global warming appears to be accelerating, and early warning signs of tipping behavior are emerging in key systems.
This loss of planetary resilience is further compounded by regional-scale ecological regime shifts and reduced functional integrity in ecosystems.
Human activities have collectively pushed Earth beyond its Safe Operating Space (see Ch. 2), driven by interconnected stressors such as fossil fuel combustion, land-use changes, and pollution. These interactions (see Ch. 2.4) amplify negative effects across multiple boundaries, such as climate change intensifying biodiversity loss or land degradation triggering severe droughts and heatwaves.
Crucially, these pressures increase the risk of crossing critical tipping points – thresholds at which Earth system components can shift irreversibly to destabilized states, such as the collapse of major ice sheets, disruption of ocean currents, or the degradation of vital ecosystems like the Amazon rainforest (see Ch. 2.3).
For instance, synthetic pollutants like plastics disrupt ocean ecosystems, weakening their capacity to sequester carbon and potentially accelerating tipping behavior. Likewise, deforestation and land degradation reduce vegetation’s ability to moderate local climates, increasing vulnerability to tipping points and regime shifts that could trigger widespread ecological collapse.
Understanding these interconnected drivers and their tipping potential through a systems-based approach reveals leverage points where targeted interventions can yield broad, systemic improvements.
Effective solutions must therefore recognize and address these interconnections and tipping risks, integrating local, regional, and global efforts, supported by robust measurement and monitoring, to return humanity safely within Earth’s planetary boundaries.
Current Status and Updates of Each Planetary Boundary
Climate Change
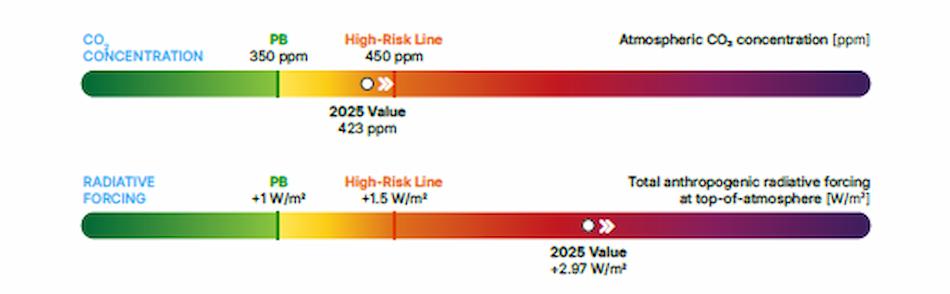
Key Drivers: Fossil fuel burning, processes leading to non-CO₂ greenhouse gas emissions, Land System Change, Change in Biosphere Integrity, Increase in Atmospheric Aerosol Loading.
Atmospheric CO₂ is now at 423 ppm in 2025, far above the Holocene baseline and the Planetary Boundary of 350 ppm, while total anthropogenic radiative forcing stands at about +2.97 W/m², twice the high-risk threshold of +1.5 W/m². Both variables have increased since 2024, with atmospheric CO₂ also approaching the High Risk Zone.
Global warming appears to be accelerating with no sign of stabilization. PHC2025 introduces global maps and graphs attributing temperature anomalies and emissions to sectors and locations, shows the Arctic warming fastest with urban-industrial regions as emission hotspots, and highlights the rising importance of methane and nitrous oxide.
Recent research draws urgent attention to tipping points like abrupt shifts in the Amazon, Atlantic Meridional Overturning Circulation, and polar ice sheets, calling for early-warning indicators and the integration of ocean heat content in Planetary Boundaries assessments.
Change in Biosphere Integrity
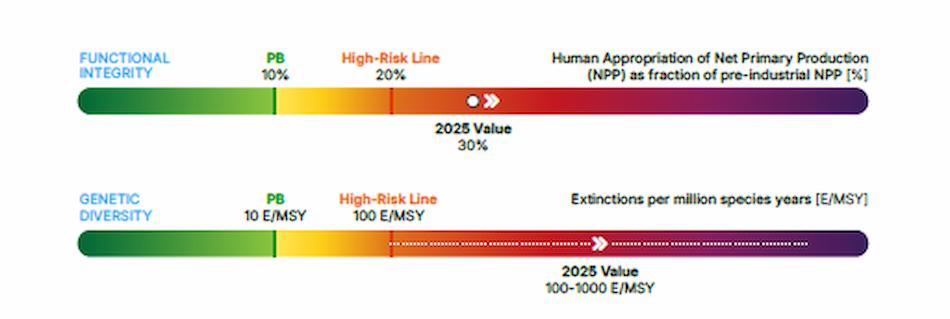
Key Drivers: Harvesting of biomass (agriculture, forestry, fishing), introduction of invasive species, Land System Change, Climate Change, Freshwater Change, Modification of Biogeochemical Flows, Introduction of Novel Entities, Ocean Acidification. The extinction rate remains above 100 E/MSY, far beyond the Planetary Boundary of 10 E/MSY, while Human appropriation of net primary production (HANPP) sits at 30% –triple the 10% Planetary Boundary and above the 20% high-risk level.
This situation has persisted or slightly worsened since 2024, with ongoing loss of genetic diversity and ecosystem function.
PHC2025 debuts the first global SEED index map showing severe biocomplexity declines, introduces the EcoRisk indicator (with up to 60% of land exceeding either local HANPP or ecosystem risk), and shows converging hotspots of degradation across multiple metrics.
The report also expands focus on the ocean biosphere’s regulatory role and prepares for a future marine functional integrity measure.
Land System Change

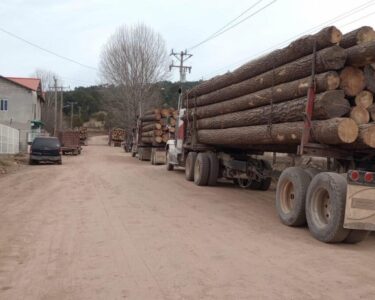
Key Drivers: Expansion of cropland and livestock grazing, wood harvesting, expansion of settlements and infrastructure, Climate Change, Freshwater Change, Biosphere Integrity. Global forest cover has fallen to ~59% –well below the 75% safe minimum– and all major biomes have breached their safety thresholds.
While the rate of decline has slowed, the situation remains deep in the Zone of Increasing Risk (approaching highrisk at ~54% cover), with ongoing deforestation and degradation keeping land-system health on a gradually worsening trajectory.
PHC2025 stresses the importance of forest quality, ecological connectivity, and function, calls for future PHCs to include fragmentation and forest integrity, and considers recalibrating boundaries as biome data improves.
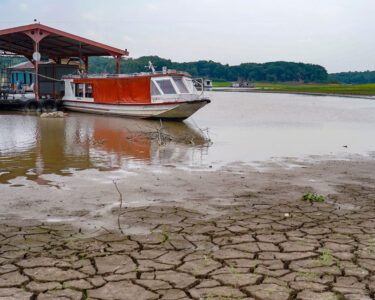
Freshwater Change
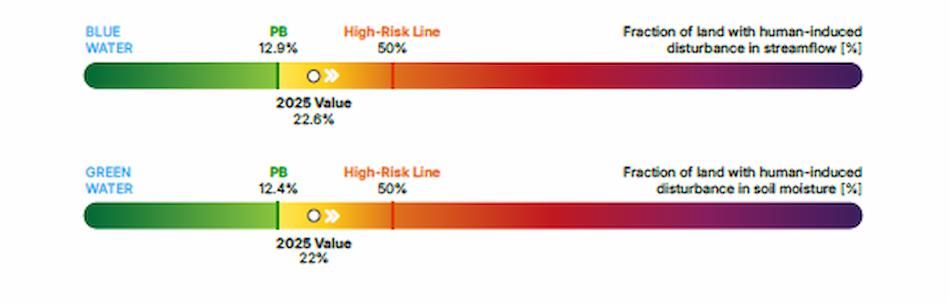
Key Drivers: Irrigation and agriculture, industrial water use, household water use, Climate Change, Increase in Atmospheric Aerosol Loading, Land System Change.
More than a fifth of global land area now faces significant dry or wet deviations in streamflow (22.6%) and soil moisture (22.0%), roughly twice the preindustrial-like baseline state and far beyond the safe levels (12.9% and 12.4%).
Both indicators are rising, putting freshwater firmly in the Zone of Increasing Risk, with major river basins such as the Indo-Gangetic Plain and North China exceeding safe levels and more pronounced extremes undermining water availability and resilience.
PHC2025 introduces basin-scale mapping of blue and green water boundary transgressions. It revises the control variable-specific boundaries and data, reflecting the current status of conditions from 2010 to 2019 (an update from the 1995 to 2005 conditions in PHC2024).
PHC2025 also identifies climate change as the dominant driver of freshwater instability and provides new explanations of feedback effects and implications.
Modification of Biogeochemical Flows
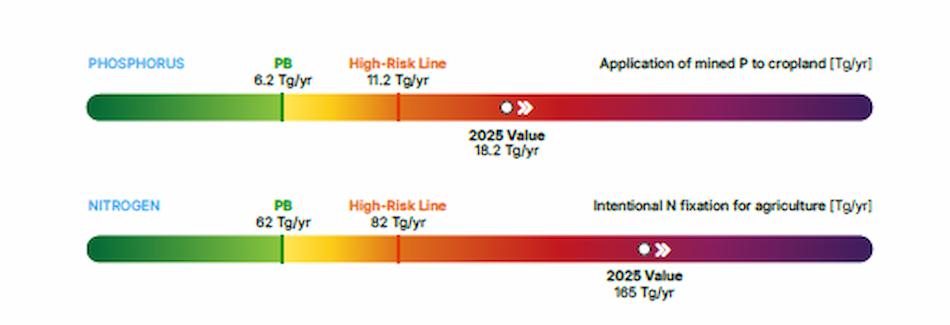
Key Drivers: Application of mined mineral phosphorus to fields as fertilizer, application of industrially-fixed nitrogen to fields as fertilizers, cultivation of nitrogenfixing crops.
Regional phosphorus application is about 18.2 Tg P/ year (triple the 6.2 Tg P/year Planetary Boundary and above the high-risk threshold), while intentional nitrogen fixation is at about 165 Tg N/year (over two times the Planetary Boundary and beyond the highrisk threshold). Both metrics remain in the High Risk Zone, with worsening trends.
PHC2025 updates all data and boundaries, systematically details nutrient pathways, inefficiencies, and legacy pollution, and proposes shifting to agricultural surplus-based control variables for both N and P, as well as including uncounted sources like fossil fuel–derived nitrogen.
Ocean Acidification
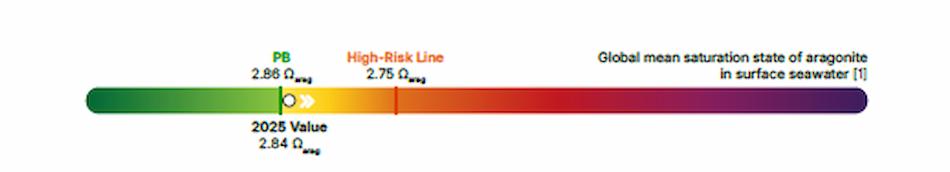
Key Drivers: Fossil fuel burning. The global mean surface aragonite saturation state (Ω) is now 2.84, just below the revised Planetary Boundary of 2.86 (corresponding to 80% of the newly-updated preindustrial Ω).
This means that, for the first time, we assess that the Planetary Boundary for Ocean Acidification has been transgressed.
Marine organisms are at increasing risk, with evidence of shell damage already occurring today, especially in polar and coastal regions. PHC2025 applies up-to-date global Ω maps, adjusts the Planetary Boundary level upward (due to a better understanding of the preindustrial state of Ω), and underscores the need to monitor impacts on sensitive species and ecosystem functions as early warning signals.
Increase in Atmospheric Aerosol Loading

Key Drivers: Fossil fuel burning, biomass burning, industrial activities. The interhemispheric aerosol optical depth difference is now about 0.063 (lower than last year and well below the safe threshold of 0.10), meaning this PB remains within the Safe Operating Space.
Global aerosol emissions are declining, even as some regions still face significant particulate pollution. PHC2025 includes new, high-resolution, chemically explicit datasets and models, explains aerosols’ dual climate role (cooling from sulfates, warming from black carbon), and emphasizes health and justice issues tied to PM2.5 – even though these regional risks aren’t yet fully captured in the Planetary Boundary metric.
Stratospheric Ozone Depletion
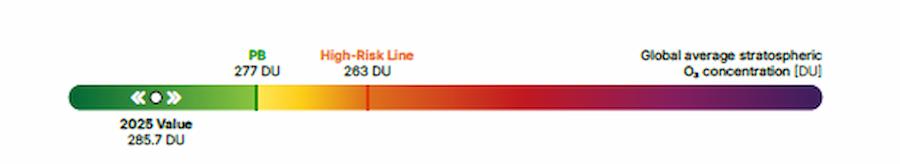
Key Drivers: Production/Emissions of Ozonedepleting substances, such as synthetic Chlorofluorocarbons and Nitrous Oxides. Global ozone concentrations remain within the Safe Operating Space, averaging 285–286 Dobson Units, above the safe threshold of ~277 DU.
Although recovery due to the Montreal Protocol continues, ozone remains below historical levels and the Antarctic ozone hole persists, so recovery is steady but incomplete.
PHC2025 does not update the control variable given in the previous report, but more explicitly connects ozone recovery to Southern Hemisphere climate changes, notes emerging risks from space debris and rocket launches, and underscores the extra-polar ozone metric as most relevant for planetary health.
Introduction of Novel Entities

Key Drivers: Industrial production of artificial chemical compounds for industry, agriculture and consumer goods. Each year, thousands of inadequately tested chemicals, plastics, and other novel entities are released into the environment, and the Planetary Boundary of zero untested entities remains persistently breached.
This burden is worse than in 2024, as production and waste volumes increase and regulations lag behind. With the current control variable for novel entities remaining difficult to quantify, PHC2025 proposes to broaden the conceptual framework and propose measurable, impact-linked candidate indicators to support a multi-faceted risk assessment.
This should include tracking stages such as production, release, fate, and Earth system effects, and refining these for key groups like plastics or genetically modified organisms.
The assessment of novel entities should thus shift from isolated evaluation to a system-oriented approach that considers mixture effects, foregrounding interdependencies and ongoing scientific uncertainties.
Contact: pbscience@pik-potsdam.de